Caregiving and Paid Work
Visit profiles to view data profiles on chronic and disabling conditions and on young retirees and older workers.
Are there trade-offs?
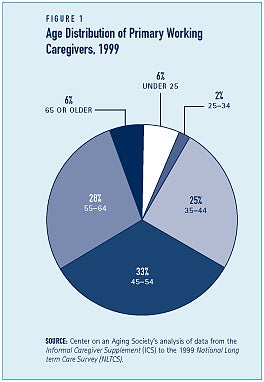
Nearly one-third — 32 percent — of all primary family caregivers, regardless of age, are in the labor force.(1) About 6 percent of working caregivers are age 65 or older while the majority — 88 percent — are between the ages of 25 and 64 (see Figure 1). Among primary caregivers of working-age, more than half — 58 percent — are employed and most of those employed (83 percent) are working full time (35 or more hours per week).
This Data Profile examines primary family caregivers age 25 to 64 who are working and those who are not working. Primary caregivers are family members, friends or volunteers who coordinate and provide the majority of the care to those who are age 65 or older and need long-term care. Long-term care is the need for assistance performing Instrumental Activities of Daily Living (IADLs), such as doing housework, managing medication or finances, or transportation, and/or Activities of Daily Living (ADLs) such as eating, bathing, dressing, using the toilet, or moving about. Moreover, “working” or “employed” refers to any primary caregiver that receives employment compensation, and the term “working-age” refers to primary caregivers age 25 to 64.
Characteristics of primary caregivers who are working compared to those not working
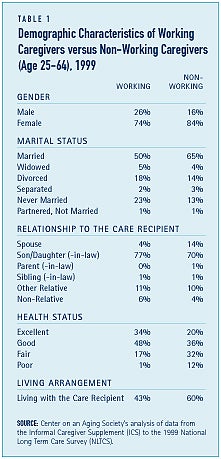
Non-working caregivers are more likely to be married women living with and providing care to their spouse (see Table 1). Working caregivers are more likely to be male, unmarried, adult children that do not live with the care recipient. About one in four working caregivers were male compared to 16 percent of non-working caregivers. More than two-thirds of non-working caregivers and half of working caregivers were married. While nearly two thirds of non-working caregivers lived with the care recipient, less than half — 47 percent — of working caregivers did. Working caregivers are much more likely to say they are in good or excellent health while non-working caregivers are more likely to say they are in fair or poor health.
Work adjustments are not uncommon
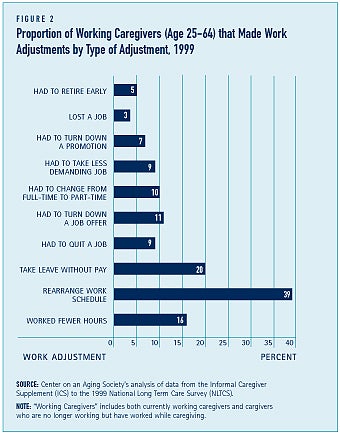
It is not uncommon for workers to make adjustments to their schedule when they are also primary caregivers (see Figure 2). Among those who have ever worked while providing care (includes both currently working caregivers and caregivers who are no longer working but have worked while caregiving), 39 percent rearranged their work schedule. Others have worked fewer hours in order to provide care or have taken time off without pay — 16 and 20 percent, respectively. Among caregivers not currently working, a substantial proportion — 56 percent — stopped working while they were a primary caregiver and 17 percent reported that they stopped working to provide care to the care recipient.(2)
Some working caregivers hesitate to tell their supervisor about their caregiving responsibilities
Some working caregivers may hesitate telling their employer about their caregiving responsibilities. Some 16 percent of working caregivers have not told their employer about their caregiving responsibilities. However, over half — 57 percent — of caregivers feel that their employer is very understanding of their caregiving demands.(3) A minority — 24 percent — of caregivers said their employer is only somewhat understanding and 3 percent reported that their employer is not very understanding.(4)
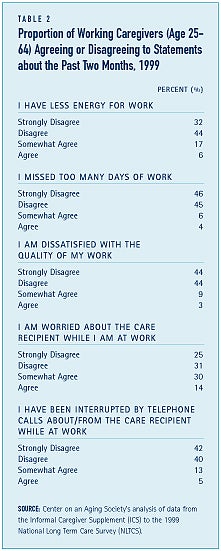
Caregiving may affect work productivity
Caregiving may also affect one’s performance at work (see Table 2). Overall, 44 percent of working caregivers have had a conflict between their job and caregiving responsibilities.(5) Over one-third of working caregivers acknowledge spending time during the work day worrying about their loved one. Nearly a quarter — 23 percent — of working caregivers acknowledge that they have had less energy at work in the past two months. Few working caregivers — 10 percent — report having to miss days of work to provide care and one in ten caregivers — 12 percent — report that they are dissatisfied with the quality of their work as a consequence of their caregiving responsibilities. Roughly 18 percent of caregivers are interrupted at work by telephone calls about or from the care recipient.
Working caregivers are better-off financially than non-working caregivers
Similar proportions — 20 percent — of working and non-working caregivers report feeling that the cost of providing care is more than they can afford. Non-workers, however, experience more overall financial strain and have lower incomes than working caregivers. Nearly one in four — 24 percent — of non-working caregivers report feeling financially strained while 19 percent of working caregivers did. Approximately 41 percent of non-working caregivers had annual household incomes below $25,000 compared to 23 percent of working caregivers.10 One study estimated that women who reduced their hours to provide care to a parent or parent-in-law gave up an average of $7,800 in pre-tax wages in 1994 (which was about 20 percent of median family income among these women).(11)
Working caregivers provide fewer hours of care
Clearly, workers face more competition for their time than non-workers. The median hours of care provided per week by working caregivers is half that provided by non-working caregivers — 10 and 20 hours, respectively.(12) However, working caregivers are more likely to have a helper if needed to provide extra care. Over two-thirds — 67 percent — of working primary caregivers say that if they were unable to help the care recipient that they had a secondary helper lined-up who could. Among non-working primary caregivers, 54 percent had a helper if they could not provide needed care.
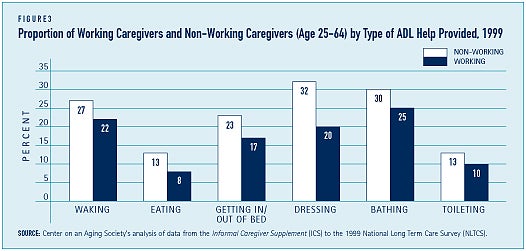
Workers provide less ADL help than non-workers
A smaller proportion of working caregivers provide help with Activities of Daily Living (ADLs) compared to non-working caregivers — 37 percent and 49 percent, respectively. Differences in the proportions of working and non-working caregivers providing help with dressing and getting in and out of bed are the most substantial (See Figure 3).
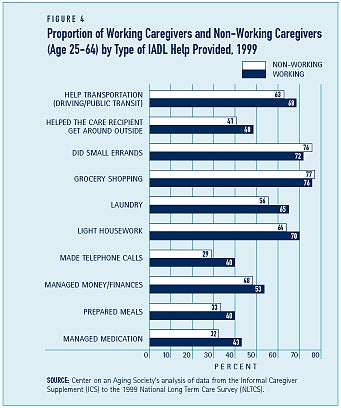
Similar proportions of workers and non-workers provide help with Instrumental Activities of Daily Living (IADLs) including money management, grocery shopping, and providing transportation. Non-working caregivers are more likely, however, to administer medications or medical care, make telephone calls, and do housework including laundry (see Figure 4).
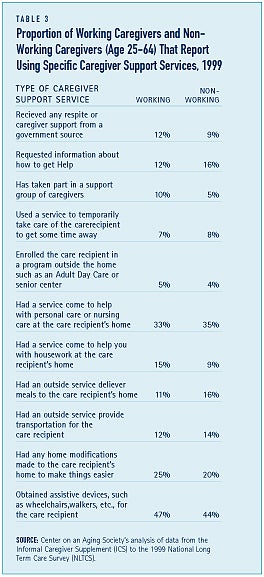
Use of formal services is more common among workers
Working caregivers are somewhat more likely to use caregiver supportive services than non-working caregivers. For example, one-tenth of working caregivers have used a respite service, compared to some 7 percent of non-working caregivers. And, the proportion of working caregivers attending a support group is double that of non-working caregivers. Compared to non-working caregivers, somewhat larger proportions of working caregivers use formal care services to help provide needed care. The most substantial difference is the use of a home modification service. Some 28 percent of those who are working compared to 18 percent of those who are not working have used a service to modify the care recipientÕs home (See Table 3). And, a larger proportion of working caregivers compared to non-working caregivers have obtained assistive devices for the care recipient Ñ some 54 and 47 percent, respectively.
1. Center on an Aging Society’s analysis of data from the Informal Caregiver Supplement to the 1999 National Long Term Care Survey.
4. MetLife Mature Market Group & National Alliance for Caregiving (NAC) (1997) The MetLife Study of Employer Costs for Working Caregivers (NY: Metropolitan Life Insurance Company). The estimated costs to businesses includes the costs associated with replacing employees, absenteeism, partial absenteeism, workday interruptions, elder care crises, and supervisor’s time spent providing support, counseling, arranging coverage for absent or late employees, and dealing with work disruptions.
5. Center on an Aging Society’s analysis of data from the Informal Caregiver Supplement (ICS) to the 1999 National Long Term Care Survey (NLTCS).
6. MetLife Mature Market Group & National Alliance for Caregiving (NAC) (1997) The MetLife Study of Employer Costs for Working Caregivers (NY: Metropolitan Life Insurance Company)
7. Piktialis, D. S. (2001) Forging Relationships with Business National Family Caregiver Support Program: From Enactment to Action Conference Issue Brief (Washington, DC: Administration on Aging), http://www.aoa.gov/prof/aoaprog/caregiver/careprof/progguidance/background/program_issues/Fin-Piktialis.pdf.
8. Families and Work Institute (1998) Business Work-Life Study: Investigating how US employers are responding to work-life needs (Executive Summary) (NY: Families and Work Institute)
9. MetLife Mature Market Institute (2003) The MetLife Study of Sons at Work Balancing Employment and Eldercare: Findings from a National Study by the National Alliance of Caregiving and The Center for Productive Aging at Towson University (NY: MetLife).
10. Center on an Aging Society’s analysis of data from the Informal Caregiver Supplement (ICS) to the 1999 National Long Term Care Survey (NLTCS). A substantial proportion — 27 percent — of respondents’ household income data were missing and excluded from the data used to calculate the distribution of caregivers by income and employment status.
11. Johnson, R. & Lo Sasso, A. (2000) The Trade-Off Between Hours of Paid Employment and Time Assistance to Elderly Parents at Midlife (Washington, DC: The Urban Institute).
12. Center on an Aging Society’s analysis of data from the Informal Caregiver Supplement (ICS) to the 1999 National Long Term Care Survey (NLTCS).