


A Decade of Informal Caregiving
Number 1, February 2005
Visit profiles to view data profiles on chronic and disabling conditions and on young retirees and older workers.
Are today’s informal caregivers different than informal caregivers a decade ago?
Informal caregivers, primarily family, but also friends and volunteers, have been and continue to be integral to the system of providing critical assistance to persons age 65 or older who need long-term care. In 1982, informal caregivers spent on average four hours per day — or an average of 28 hours per week — providing care.(1) Seventeen years later, caregivers continue to provide nearly the same amount of care — an average of 26 hours per week.(2) Between 1989 and 1999, the number of caregivers of older persons increased from approximately 3.2 million(3) to 3.4 million(4) — an increase of about six percent.
This Data Profile provides an overview of informal caregivers today compared to caregivers a decade ago. For the purpose of this Data Profile, the term “informal caregiver” refers to the primary, unpaid helper of people age 65 or older residing in the community who need assistance with one or more basic everyday activities. Basic everyday activities are daily routine tasks that involve either activities of daily living (ADL), such as eating, bathing, using the toilet, or moving about, and/or instrumental activities of daily living (IADL) such as doing housework, managing finances or medication, or transportation. The term “older people” refers to the population age 65 or older.
Who are the primary caregivers?
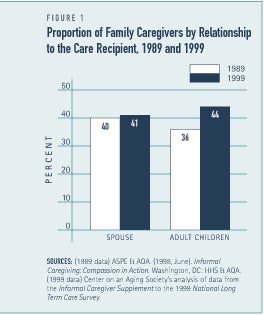
The majority of older people who need help performing basic everyday activities rely exclusively on assistance from family members or friends for their long-term care needs. Spouses and adult children continue to provide the majority of informal long-term care. Roughly 40 percent of informal caregivers were spouses in both 1989 and 1999 (see Figure 1). Compared to a decade earlier, adult children are slightly more likely to provide care than spouses. A slightly larger portion of informal caregivers are adult children today than a decade ago — 44 percent in 1999 and 36 percent in 1989. Other family members and friends are less likely to be the primary caregiver but are nonetheless critical to the long-term care provided, typically as secondary caregivers.
Spouses provide the most hours of care
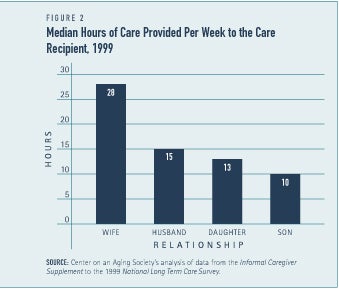
In 1999, spouses provided more hours of care per week than any other type of informal caregiver (see Figure 2). Wives and husbands provided an average of 28 hours and 15 hours of care per week, respectively. Adult children also devote a large amount of their time to provide long-term care. Daughters provided, on average, 13 hours of care per week and sons provided 10 hours of care per week.
More men are taking on the role of informal caregiver than a decade ago
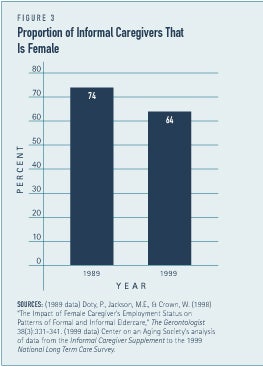
Although women continue to provide the majority of care, men account for a larger proportion of caregivers today than they did ten years ago. In 1989, women accounted for almost three-fourths of informal caregivers compared to slightly more than two-thirds today (See Figure 3). Over the past decade, the proportion of men providing informal care has increased from 26 percent to 31 percent. Various factors likely contributed to this change such as the increased life expectancy of men, increased labor force participation of women, the changing composition of families, and the socialization of gender roles.(5) The increase in male caregivers could continue into the future, potentially increasing the supply of caregivers and decreasing the burden on female family members to provide care to those in need of assistance.
Older informal caregivers continue to be the primary source of care
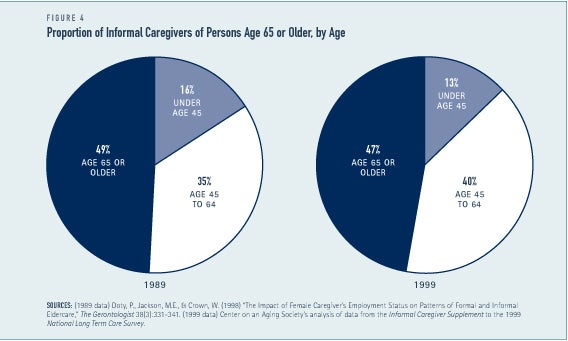
Over the past decade, the proportion of family caregivers age 65 or older has decreased slightly from 49 percent to 47 percent but continue to represent the majority of informal caregivers (see Figure 4). Today, caregivers age 45 to 64 represent a larger proportion of caregivers than in 1989 — 40 percent and 35 percent, respectively. The proportion of primary family caregivers under the age of 45 has decreased slightly from about 16 percent in 1989 to 13 percent today. The average age of informal caregivers has increased slightly from 60.3 years of age in 1989 to 62.7 years of age in 1999.
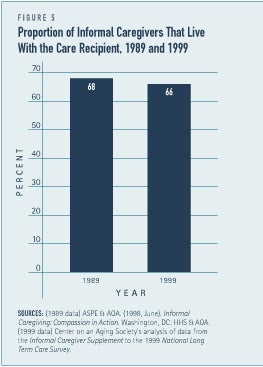
Caregiver living arrangements and stress have not changed much
Primary caregivers most often live with the person for whom they are providing care. In 1989 and 1999, about two-thirds of informal caregivers were living with the care recipient (see Figure 5). Caregivers living with the care recipient are more likely to report higher levels of stress associated with their caregiving responsibilities.(6)
Providing long-term care can be both physically and emotionally stressful. The proportion of primary caregivers reporting their own health status as fair or poor has not changed much. Over the past decade, the proportion of family caregivers reporting their own health as fair or poor decreased slightly from 31 percent to 29 percent between 1989 and 1999.
Fewer caregivers have competing childcare responsibilities
Caregiving can compete with other family responsibilities. Over the past decade, however, the proportion of informal caregivers with children under the age of 18 has decreased. In 1989, about one-fourth of informal caregivers had children under the age of 18 living in the same household.(7) In 1999, however, ten percent of informal caregivers were also caring for children under the age of 18 in the home.
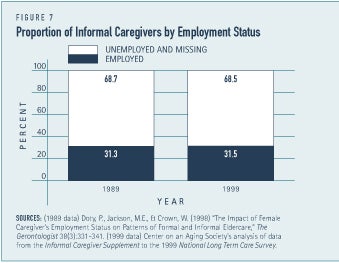
Similar proportions of caregivers were employed in 1989 and 1999
A substantial minority of caregivers continue to work while providing care to older family members or friends. In 1989 and 1999, nearly one-third of informal caregivers were employed (see Figure 7). Furthermore, a larger proportion of employed caregivers are working full-time (35 or more hours per week) than a decade ago. In 1989, about 67 percent of employed caregivers were working full time(8) compared to 78 percent in 1999.(9) Today, employed caregivers work an average of 38.4 hours each week compared to 36.9 hours per week in 1989.
Nevertheless, many working caregivers may need to make some form of accommodation to their employment situation such as decreasing the hours that they work, rearranging their work schedule, or taking leave without pay. In 1989, the majority of employed caregivers — 81 percent — decreased the amount of hours they worked and 42 percent rearranged their work schedules to provide more hours of informal long-term care.(10) In 1999, 17 percent of employed caregivers worked fewer hours, 31 percent rearranged their work schedule, and 16 percent took time off from work without pay to provide long-term care.(11)
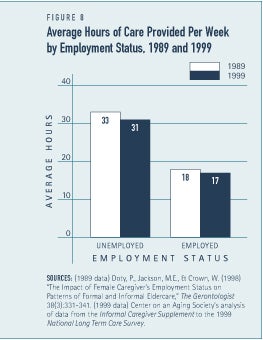
Employed caregivers continue to provide substantial amounts of care
Although employed caregivers provide fewer hours of care compared to non-employed caregivers, they continue to provide substantial amounts of care. Today, working caregivers provide, on average, 17 hours of care per week and in 1989 they provided an average of 18 hours of care per week (see Figure 8).
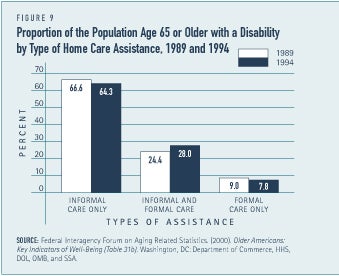
Formal care for older people is not widely used
Informal care continues to be the primary source of long-term care for older people living in the community with limitations performing basic everyday activities. Among the older population with limitations, 67 percent relied exclusively on informal care from family members or friends in 1989 compared to 64 percent in 1994.(12) A larger pro-portion of older people with limitations, however, did supplement informal care with formal, paid assistance than a decade ago (see Figure 9). Roughly one-fourth — 24 percent — of the older population with limitations relied on both formal and informal care in 1989. In 1994, nearly a third — 28 percent — received formal and informal care. However, by the same token, the proportion of older persons who relied exclusively on formal care declined. The proportion of older people living in the community with limitations performing basic everyday activities that relied solely on formal paid care for their long-term care needs decreased from 9.0 percent in 1989 to 7.8 percent in 1994.
Conclusion
Over the past decade there has been a decline in disability rates and in mortality rates. As a consequence, more people are living longer but developing a chronic and debilitating condition at an older age. This has affected the timing of when care is needed and it has also affected the nature of the care that is needed. Caregivers are generally older than they were in the past because the need for long-term care is appearing at older ages. Moreover, since much of the decline in disability rates has been in IADL limitations and not ADL limitations, the type of care needed has changed.(13)
1. Burwell, B. & Jackson, B. (1994) The Disabled Elderly and Their Use of Long-Term Care. Washington, DC: Department of Health and Human Services (HHS), http://aspe.hhs.gov/daltcp/reports/diseldes.htm.
2. Center on an Aging Society’s analysis of data from the Informal Caregiver Supplement to the 1999 National Long-Term Care Survey.
3. Burwell & Jackson. (1994).
4. Center on an Aging Society..
5. Anderson, E. K.. (January, 2003) “Men as Caregivers: Theory, Research, and Service Implications,” edited by Kramer, B. J. & Thompson, E. H. (New York, NY: Springer Publishing, 2002). Review in Contemporary Sociology 32(1): 34-35.
6. National Alliance for Caregiving and AARP (April, 2004) Caregiving in the U.S. Washington, DC: MetLife Foundation, p. 57, http://www.caregiving.org/04finalreport.pdf.
7. Burwell & Jackson (1994).
8. The Office of the Assistant Secretary for Planning and Evaluation (ASPE) & the Administration on Aging (AOA) (1998), Informal Caregiving: Compassion in Action, Washington, DC: Department of Health and Human Services (HHS) and AOA.
9. Center on an Aging Society.
10. Burwell & Jackson (1994)
11. Center on an Aging Society.
12. Federal Interagency Forum on Aging Related Statistics. (2000). Older Americans 2000: Key Indicators of Well-Being (Table 31b). Washington, DC: Federal Interagency Forum on Aging Related Statistics.
13. Friedland, R. (2004) Caregivers and Long-Term Care Needs in the 21st Century: Will Public Policy Meet the Challenge? Issue Brief (Washington, DC: Georgetown University Long Term Care Financing Project), http://ltc.georgetown.edu/pdfs/caregiversfriedland.pdf.
ABOUT THE DATA
Unless otherwise noted, the data presented in this Profile are from the 1999 National Long Term Care Survey (NLTCS) and its Informal Caregivers SUpplement (ICS). Additionally, data from the 1989 and 1994 NLTCS and the ICS to the 1989 NLTCS, are presented to illustrate how informal caregiving has changed over the past decade. The NLTCS and the ICS are sponsored by the U.S. Department of Health and Human Services and conducted by the Center for Demographic Studies at Duke University. The National Long-Term Care Surveys are nationally-representative, household surveys of the population age 65 or older living in both the community and institutional settings. The Informal Caregiver Supplement to the NLTCS collects data on the experiences of the primary informal caregivers of the disabled population age 65 and older living in the community.
The ICS defines p[rimary caregivers as persons providing the most hours of unpaid assistance with either Activities of Daily Living (ADL) or Instrumental Activities of Daily Living (IADL).
ABOUT THE PROFILES
This is the first in a set of Data Profiles, Family Caregivers of Older Persons. The series is supported by a grant from AARP and MatherLifeWays. This Profile was written by Katherine Mack and Lee Thompson with assistance from Robert Friedland.
The Center on an Aging Society is a Washington-based nonpartisan policy group located at Georgetown University’s Institute for Health Care Research and Policy. The Center studies the impact of demographic changes on public and private institutions and on the economic and health security of families and people of all ages.